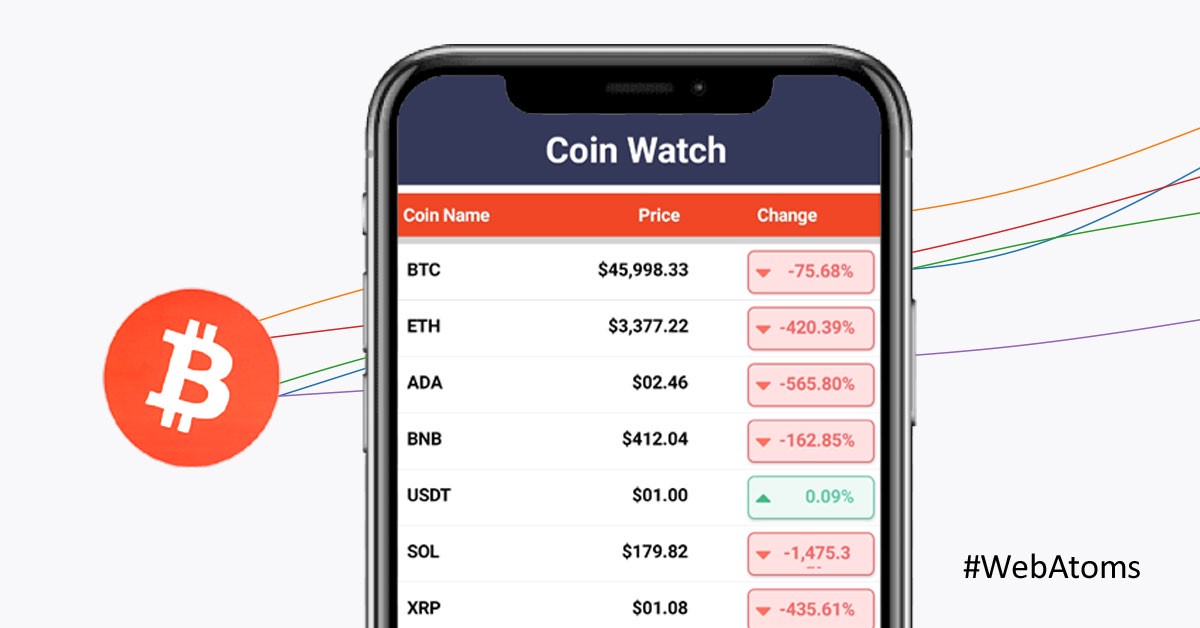
This section provides a quick overview of WebAtoms XFListView user interface control for Xamarin Forms.
Create a Simple XFListView
This section explains how to create a XFListView in WebAtoms Xamarin Forms. In this particular example we will show the real-time crypto data from free public APIs." Since the API gets many hits in a day, we are replacing it with mock data.
Creating a Data Model for XFListView.
Create a simple data source as shown in the following code example in a new class file. It has the all the properties which we are going to bind to our XFListView user interface control.
export default class ICoinWatchModel {
    symbol?: string;
    priceUsd?: string;
    changePercent24Hr?: string;
};
Creating a simple ViewModel.
This sections explains how to load the data source using mock data.
  export default class XFCoinWatchViewModel extends AtomViewModel {

    public coinList: ICoinWatchModel[] = [];

    public option = {
        style: 'percent',
        minimumFractionDigits: 2,
        maximumFractionDigits: 2
     };
     public percentageFormatter = new Intl.NumberFormat("en-US", this.option);

     public coins:ICoinWatchModel[] = [
       {
            symbol: "BTC",
            priceUsd: "46115.0480271388304650",
            changePercent24Hr: "-0.5095168590745112",
        },
        {
            symbol: "ETH",
            priceUsd: "3387.2839227538603109",
            changePercent24Hr: "-3.8610020887697443",
        },
        {
            symbol: "ADA",
            priceUsd: "2.4690387416910484",
            changePercent24Hr: "-5.1234648122416866"
        },
        {
            symbol: "BNB",
            priceUsd: "413.6486527570754022",
            changePercent24Hr: "-1.2227312211470998"
        },
        {
            symbol: "USDT",
            priceUsd: "1.0005463306761874",
            changePercent24Hr: "0.0139636869853852"

        },
        {
            symbol: "SOL",
            priceUsd: "182.0717581022814142",
            changePercent24Hr: "-14.0451497633219732"
        },
        {
            symbol: "XRP",
            priceUsd: "1.0861040549891727",
            changePercent24Hr: "-3.8228157386158285"
        }
     ]
    @Load({init: true})
    public async loadCoins() {
      this.coinList.replace(this.coins);
    }

   public formatPercentage(value:number) {
       return this.percentageFormatter.format(value);
   }

    public format(value: number) {
        return new Intl.NumberFormat("en-US",
             {
                style: 'currency',
                currency: 'USD',
                minimumIntegerDigits:2
             }).format(value);
    }

}
In the above ViewModel, we have loaded the data source in loadCoins method.If init is true, method will be executed when ViewModel is initialized.The difference in the current market value is shown as percentage; column named 'Change', the currency under Price column is formatted using Intl.NumberFormat.
Binding data to the XFListView.
To bind the data source of the XFListView, set the itemsSource property as shown as follows,The following code example binds the collection created in the ViewModel. Using the one way bindings and Math.sign function of JavaScript to check the number is positive or negative.
export default class XFCoinWatch extends AtomXFContentPage {

    public viewModel: XFCoinWatchViewModel;

    public create() {
        this.viewModel = this.resolve(XFCoinWatchViewModel);
        this.render(<XF.ContentPage
                               title="Coin Watch"
                               backgroundColor="White">
            <XF.Grid margin="5"
               rowDefinitions="auto,*" columnDefinitions="*">
                   <XF.StackLayout
                        backgroundColor="#34395A"
                        horizontalOptions="FillAndExpand">
                        <XF.Label
                            horizontalTextAlignment="Center"
                            horizontalOptions="CenterAndExpand"
                            text="Coin Watch"
                            fontAttributes="Bold"
                            fontSize="28"
                            padding="10"
                            textColor="White"/>
                    </XF.StackLayout>
                    <XF.Grid backgroundColor="lightgray" { ... XF.Grid.row(1)}>
                        <XF.Grid rowDefinitions="auto,*" columnDefinitions="*">
                            <XF.Grid
                                columnDefinitions="*,150,100"
                                backgroundColor="#f04726"
                                heightRequest="30"
                                padding="2">
                                <XF.Label
                                    { ... XF.Grid.column(0)}
                                    horizontalTextAlignment="Start"
                                    fontAttributes="bold"
                                    padding="5"
                                    text="Coin Name"
                                    textColor="White" />
                                <XF.Label
                                    { ... XF.Grid.column(1)}
                                    horizontalTextAlignment="End"
                                    padding="0,5,50,0"
                                    fontAttributes="bold"
                                    text="Price"
                                    textColor="White"/>
                                <XF.Label
                                    { ... XF.Grid.column(2)}
                                    horizontalTextAlignment="Start"
                                    fontAttributes="bold"
                                    padding="5"
                                    text="Change"
                                    textColor="White" />
                            </XF.Grid>
                            <XF.Grid
                                { ... XF.Grid.row(1)}>
                                <XF.ListView itemsSource={Bind.oneWay(() => this.viewModel.coinList)}>
                                    <XF.ListView.itemTemplate>
                                        <XF.DataTemplate>
                                            <XF.ViewCell>
                                                <XF.Grid
                                                    columnDefinitions="*,150,100"
                                                    padding="5"
                                                    backgroundColor={Colors.white}>
                                                    <XF.Label
                                                        { ... XF.Grid.column(0)}
                                                        padding="5"
                                                        fontAttributes="bold"
                                                        textColor={Colors.black}
                                                        text={Bind.oneWay((x) => x.data.symbol)}/>
                                                    <XF.Label
                                                    { ... XF.Grid.column(1)}
                                                        padding="5,5,40,0"
                                                        fontAttributes="bold"
                                                        horizontalOptions="End"
                                                        horizontalTextAlignment="End"
                                                        textColor={Colors.black}
                                                        text={Bind.oneWay((x) => this.viewModel.format(x.data.priceUsd))} />
                                                    <XF.Frame   { ... XF.Grid.column(2)}
                                                        padding="1"
                                                        cornerRadius="5"
                                                        hasShadow="false"
                                                        backgroundColor={Bind.oneWay((x) => Math.sign(x.data.changePercent24Hr) === -1 ? "#FFE1e1": "#EDF9f5")}
                                                        borderColor={Bind.oneWay((x) => Math.sign(x.data.changePercent24Hr) === -1 ? "#F76868": "#64CAAA")}>
                                                    <XF.StackLayout orientation="Horizontal"
                                                                padding="5">
                                                        <XF.Image horizontalOptions="Center">
                                                            <XF.Image.source>
                                                                <XF.FontImageSource
                                                                    color={Bind.oneWay((x) => Math.sign(x.data.changePercent24Hr) === -1 ? "#ff7060": "#41ba86")}
                                                                    size={20}
                                                                    fontFamily={FontAwesomeSolid}
                                                                    glyph={Bind.oneWay((x) => Math.sign(x.data.changePercent24Hr) === -1 ?
                                                                        FontAwesomeSolid.caretDown:
                                                                        FontAwesomeSolid.caretUp)}
                                                                    />
                                                            </XF.Image.source>
                                                        </XF.Image>
                                                        <XF.Label
                                                            horizontalOptions="EndAndExpand"
                                                            horizontalTextAlignment="Center"
                                                            fontAttributes="Bold"
                                                            padding="0,0,10,0"
                                                            textColor={Bind.oneWay((x) => Math.sign(x.data.changePercent24Hr) ===-1 ? "#F76868": "#64CAAA")}
                                                            text={Bind.oneWay((x) => this.viewModel.formatPercentage(x.data.changePercent24Hr) )}>
                                                        </XF.Label>
                                                    </XF.StackLayout>
                                                 </XF.Frame>
                                           </XF.Grid>
                                        </XF.ViewCell>
                                        </XF.DataTemplate>
                                    </XF.ListView.itemTemplate>
                                </XF.ListView>
                            </XF.Grid>
                    </XF.Grid>
                </XF.Grid>
            </XF.Grid>
        </XF.ContentPage>);
    }
}
See Also
 |  |  |  |
| Like | Comment | Save | Share |
/api/attachments/att/4/linkedin-null-nan-1200-628.png/linkedin-null-nan-1200-628.100.jpg)
/api/attachments/att/249/webP.gif/webP.100.jpg)
